Linux has many available tools that simply just work. That’s why I prefer it over other operating systems. I can get things done, usually faster and much simpler from a command line in a terminal, or multiple terminals.
Windows has useful and powerful shells, and I use them when I need to work on that OS, but I prefer to work in bash. I make use of simple, but elegant installation applications, most notably Apt and PacMan – depending on which of my two preferred distros I have installed. I can install simple, but powerful tools to pull out information about my system’s operation and performance.
nmon:
One of my goto tools is nmon. (Nigel’s performance Monitor for Linux) – originally used by IBM and released as open-source in 2009.
I wouldn’t categorize “nmon” as old school, but it sure has that vibe going on. Anything I can run in a terminal from a command line to see what is not always obvious is useful. The ability to export the data it gathers as .csv to use in a graph or for use in analyses applications is sometimes overlooked by casual users – but it’s available.
I don’t use the export function, but I expect that it might be beneficial in some situations. I mostly use nmon in the “Interactive mode” Just a quick glance at some of the output screens presents you with a lot of useful performance information.
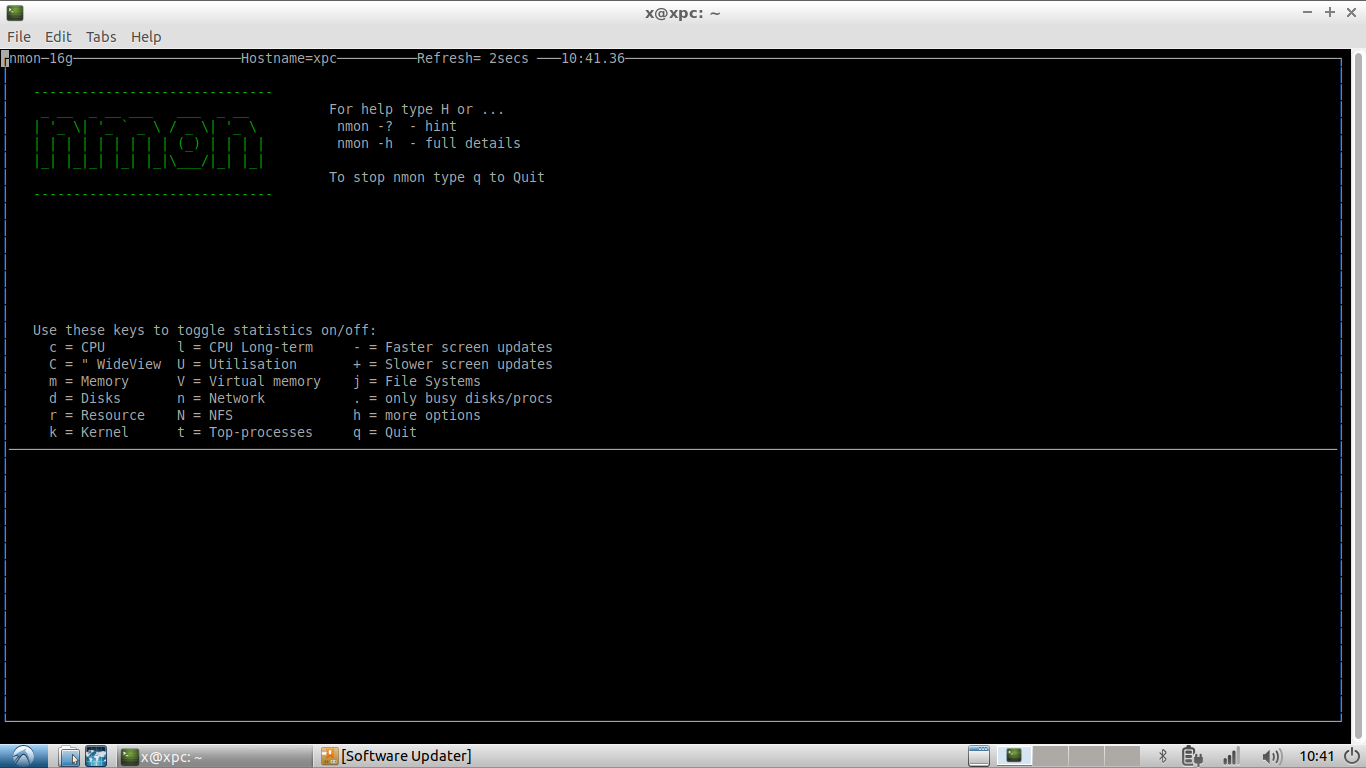
From NMON (nmon -h) Hints:
For Data-Collect-Mode
-f Must be the first option on the line (switches off interactive mode)
Saves data to a CSV Spreadsheet format .nmon file in the local directory
Note: -f sets a default -s300 -c288 which you can then modify
Further Data Collection Options:
-s <seconds> time between data snapshots
-c <count> of snapshots before exiting
-t Includes Top Processes stats (-T also collects command arguments)
-x Capacity Planning=15 min snapshots for 1 day. (nmon -ft -s 900 -c 96)
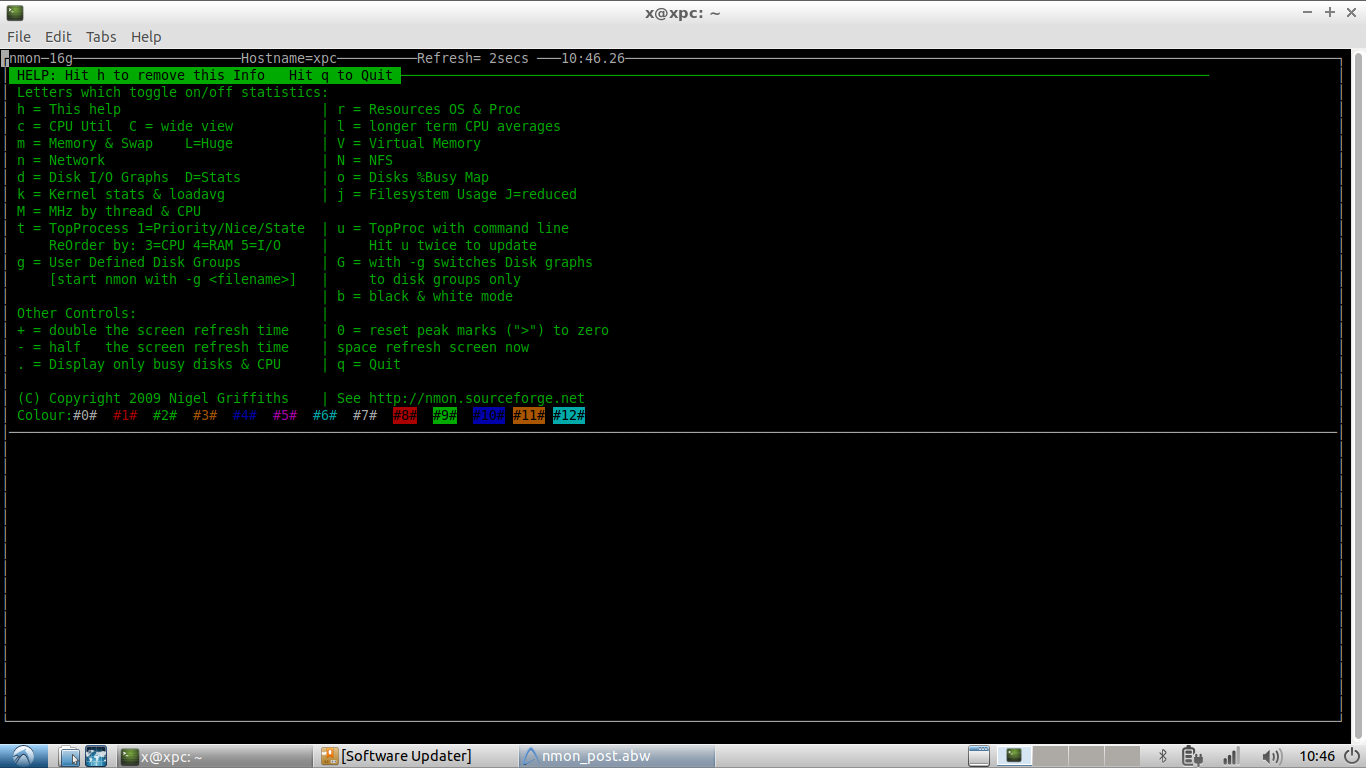
Although you can gather and present much data quickly,
don’t just glance at the data – really look at what it’s telling you, and if you don’t understand what you’re looking at – then look it up and find out what you may be missing.
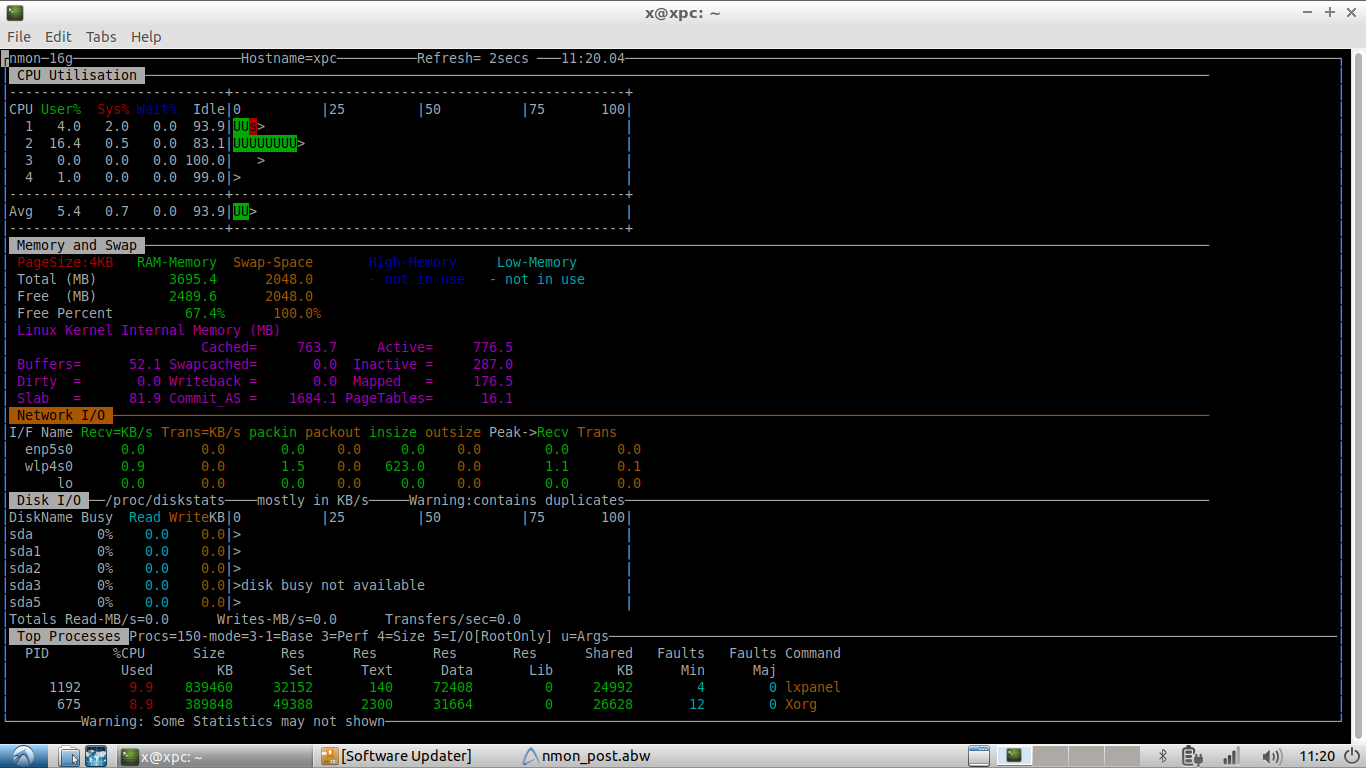
Key
— Toggles on/off to control what is displayed —
b = Black and white mode (or use -b command line option)
c = CPU Utilization stats with bar graphs (CPU core threads)
C = CPU Utilization as above but concise wide view (up to 192 CPUs)
d = Disk I/O Busy% & Graphs of Read and Write KB/s
D = Disk I/O Numbers including Transfers, Average Block Size & Peaks (type: 0 to reset)
g = User Defined Disk Groups (assumes -g <file> when starting nmon)
G = Change Disk stats (d) to just disks (assumes -g auto when starting nmon)
h = This help information
j = File Systems including Journal File Systems
J = Reduces “j” output by removing unreal File Systems
k = Kernel stats Run Queue, context-switch, fork, Load Average & Uptime
l = Long term Total CPU (over 75 snapshots) via bar graphs
L = Large and =Huge memory page stats
m = Memory & Swap stats
M = MHz for machines with variable frequency 1st=Threads 2nd=Cores 3=Graphs
n = Network stats & errors (if no errors it disappears)
N = NFS – Network File System
1st NFS V2 & V3, 2nd=NFS4-Client & 3rd=NFS4-Server
o = Disk I/O Map (one character per disk pixels showing how busy it is)
Particularly good if you have 100’s of disks
q = Quit
r = Resources: Machine type, name, cache details & OS version & Distro + LPAR
t = Top Processes: select the data & order 1=Basic, 3=Perf 4=Size 5=I/O=root only
u = Top Process with command line details
U = CPU utilization stats – all 10 Linux stats:
user, user_nice, system, idle, iowait, irq, softirq, steal, guest, guest_nice
v = Experimental Verbose mode – tries to make recommendations
V = Virtual Memory stats
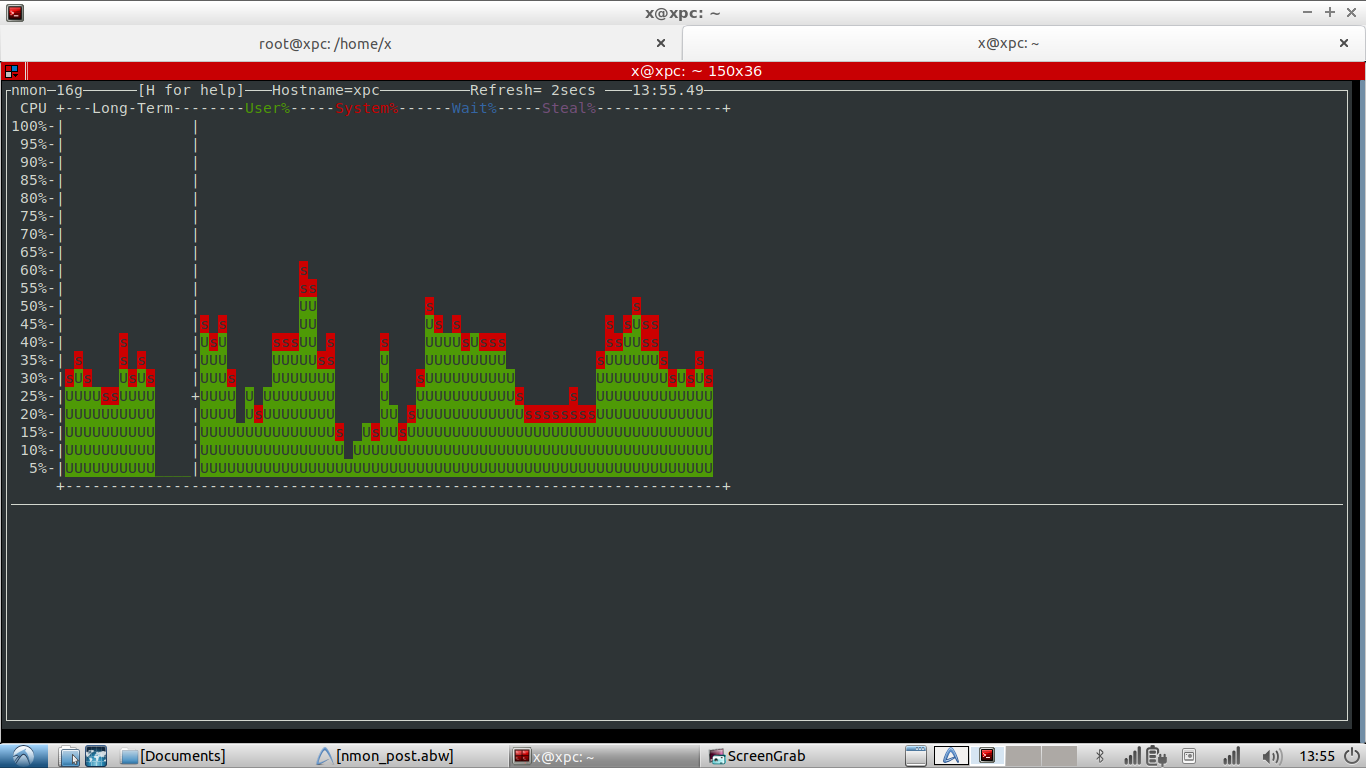
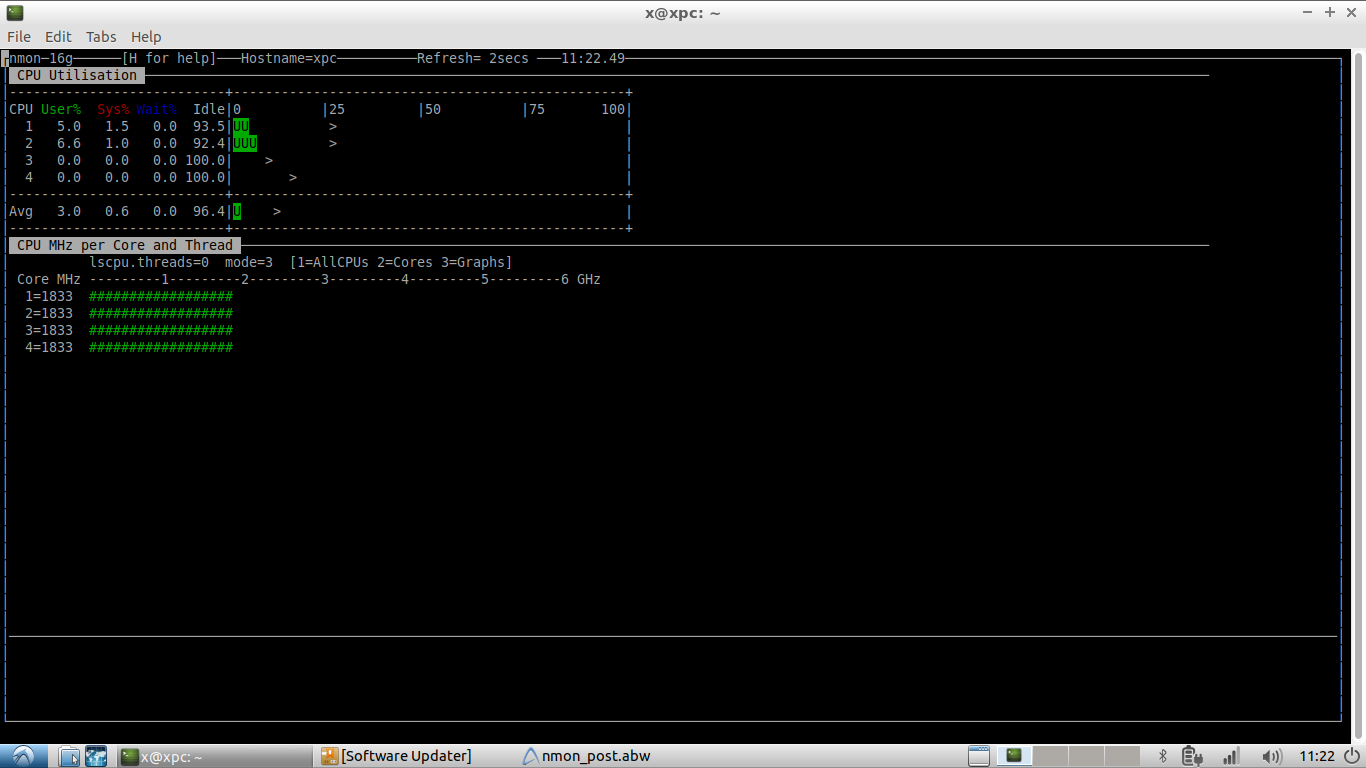
I find the info useful and sometimes will set up multiple terminals using Terminator.
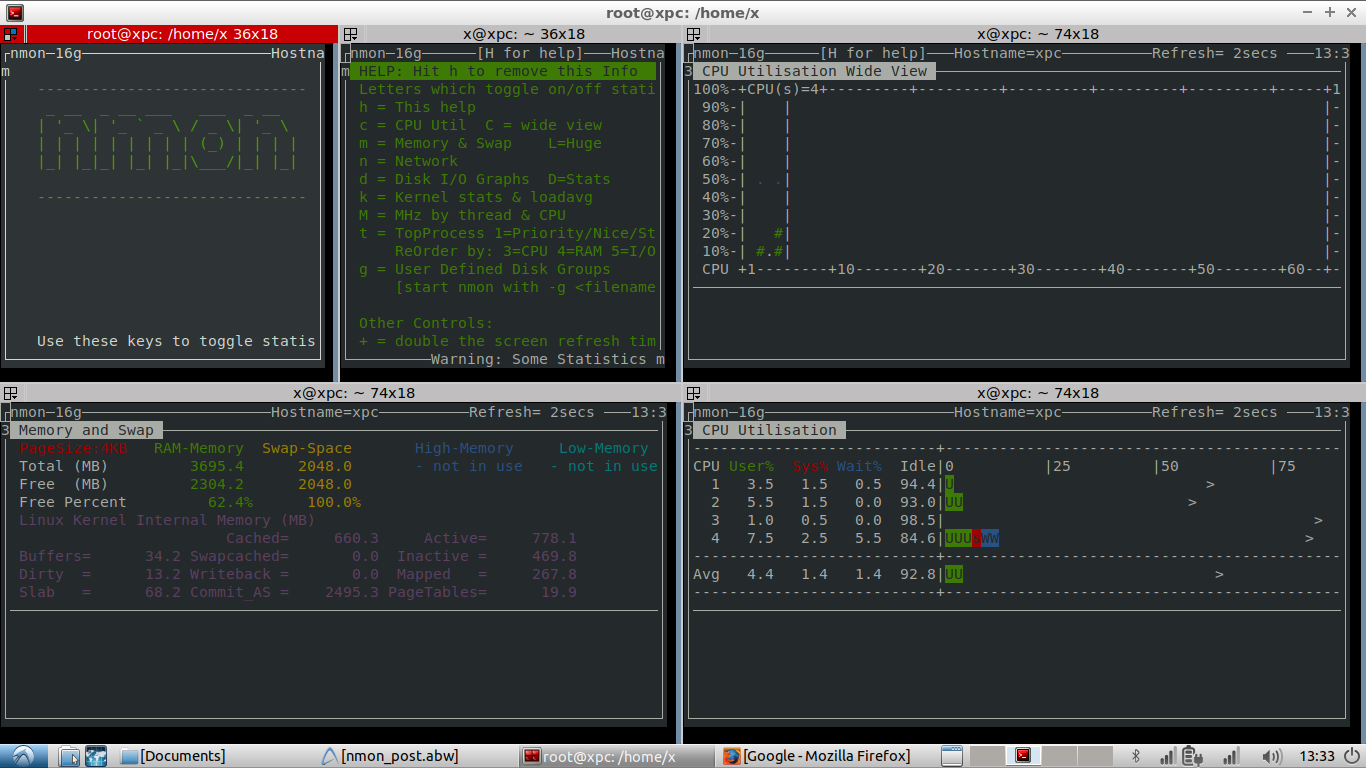
You may find NMON useful, and a good tool to see what’s going on behind the scenes on your LINUX system.